- バックアップ一覧
- 差分 を表示
- 現在との差分 を表示
- ソース を表示
- 6.2 1次元可視化 へ行く。
神戸大学 大学院システム情報学研究科 計算科学専攻 陰山 聡
【2010.07.08: 講義後追記】 変更箇所
- スクリプトでgnuplotを使う場合、グラフがグラフが一瞬描かれた直後に終了してしまうという問題があった。これを避けるにはgnuplotスクリプトの最後の一行に
pause -1
と書く必要がある。 以下のコンテンツではこの点に修正を加えた。 - ソースコードheat1_animation_x_prof.f90が抜けていた問題を修正した。
【目次】
可視化の必要性 †
上の例では、MPIプロセスがもつ配列uの値をテキストデータとして書き出すことで、 プロセス間のMPI_SENDRECVによる通信の様子が分かりやすく表示された。 このように人間の視覚を使って情報を引き出す操作を一般に可視化という。
科学技術計算においては、可視化が様々な局面で重要な役割を果たす。 特に、計算結果として出力される数値データに潜む情報を引き出すための可視化―これをデータ可視化という―は、 不可欠と言ってよい。
データ可視化の身近な例は天気図であろう。
NKHラジオの「気象通報」という番組を知っているだろうか? 各地の風向、風力、気圧などの数字をアナウンサーが次々に読み上げていくラジオ番組である。 これをただ耳で聞いているだけでは何もわからない。 しかしペンと地図を手にし、番組を聞きながら読み上げられる各地点に気圧などを書き込み(専用の地図を売っている)、 最後に同じ気圧になりそうな点を曲線(等高線)でつなげていくと、 低気圧や高気圧が図―天気図―としてあらわれる。 知識のある人が天気図を見れば、 明日の天気がだいたいわかる。
この天気図に入っている情報は、 もともとラジオのアナウンサーが読み上げる数値データに全て含まれているものである。 だが、そのような数値データの羅列をいくら注意深く聞いても、 あるいはそれを数表にして紙の上に書き、それをじっと睨んでみても、 明日の天気を知るのはほとんど不可能である。 紙の上に天気図という図にしてみてはじめてデータに隠されていた情報を引き出すことができる。 これが可視化である。
可視化の例 †
データの可視化には可視化の目的や、対象データの種類の応じて様々な方法が開発されている。 その中で、ここでは、スカラー場の可視化について簡単に説明する。
1次元グラフ †
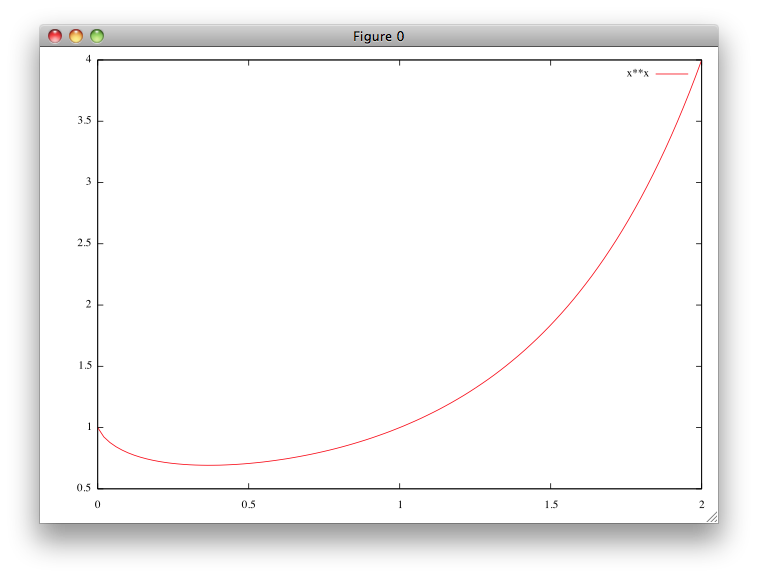
xのある関数f(x)を直感的に理解するためには、グラフを書くのが一番である。 例えばxのx乗の関数、つまりf(x)=x^xはどんな形だろうか? 下のグラフを見ればわかる。
2次元等高線 †
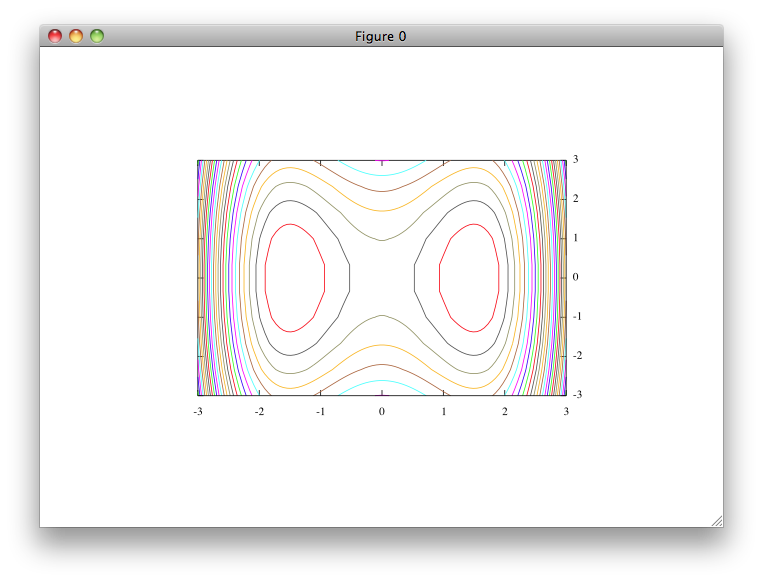
xとyの関数、つまり2次元の関数f(x,y)の形を理解するには、等高線を描くのがよい。 地表面での大気の圧力pの分布p(x,y)の等高線は天気図でおなじみである。
上の図では等高線の高さを色で表示してさらに分かりやすくしている。
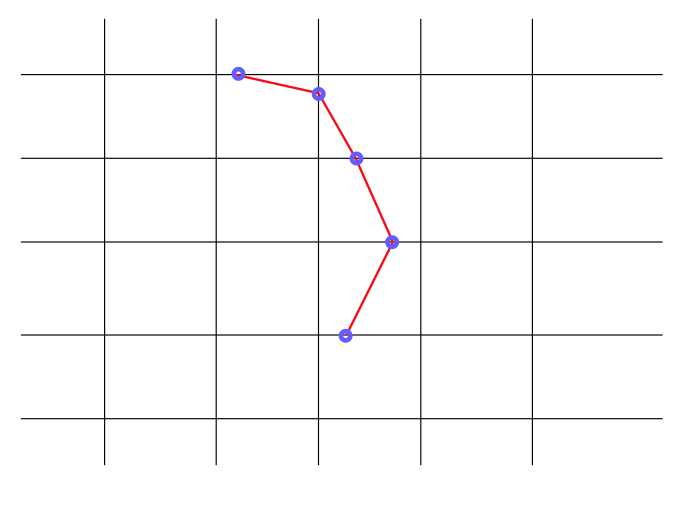
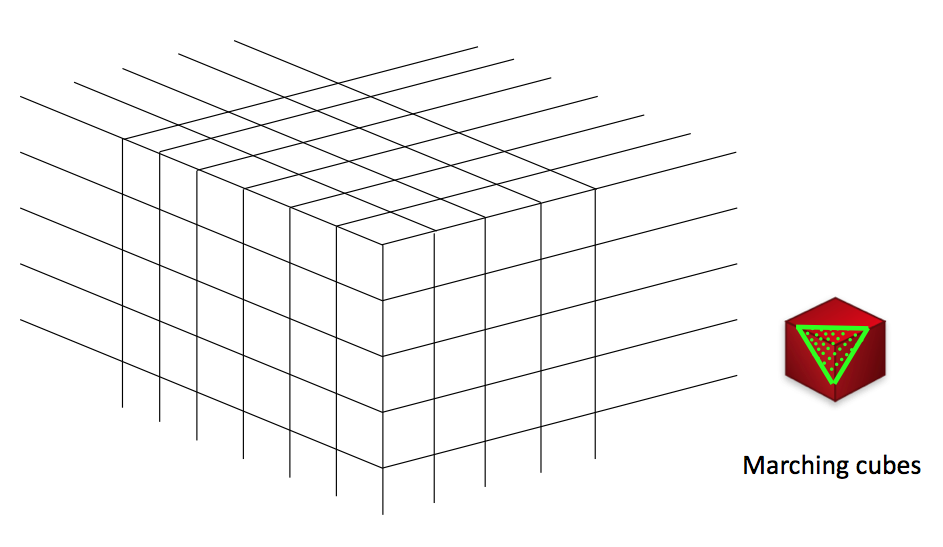
ここで等高線の描画アルゴリズムを紹介しよう。 計算格子点上に定義されたデータから一本の等高線を描くには、下の図のように短い線分をつなげていけばよい。
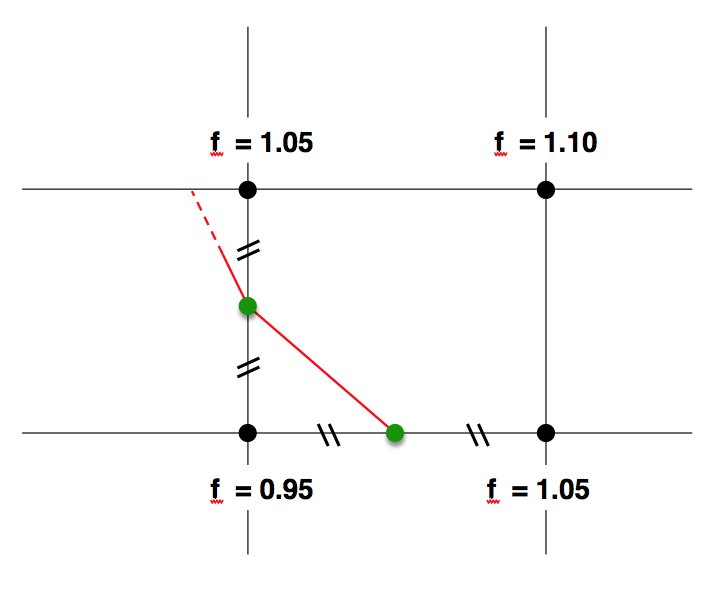
一つの線分は4つの計算格子点で定義された長方形領域(セル)の中で直線を描く。 例えばf(x,y)=1.0の値の等高線を描く場合を考えよう。 あるセルの4つの頂点におけるfの値が全て1.0よりも大きいか、あるいは1.0未満であれば、f=1.0の等高線はこのセルを通らないのは明らかである。
セルを周囲の4つの辺、それぞれの両端の頂点でのfの値が1.0を「挟めば」その辺を等高線が通る。 辺上のどの位置を等高線が横切るかは、線形補間をすればよい。 下の図はちょうど中点を通る例である。
このアルゴリズムはmarching squaresと呼ばれる。 等高線による可視化とは2次平面上に分布するスカラー場f(x,y)を 等高線という曲線を見ることで理解する方法である。
3次元等値面 †
等値面の「3次元版」も考えられる。 この場合は3次元空間中の曲面の形状を見ることで3次元空間に分布する関数f(x,y,z)の分布を理解する。 たとえば、f(x,y,z)がある値(例えば1.0)をとる点の集合は、曲面の方程式 f(x,y,z)=1.0 で定義される。
下の図の白い矢印で示している物体は等値面の例である。 これは核融合実験装置(LHD)内部のプラズマの圧力分布の等値面である。
このような等値面を描くためのアルゴリズムとしてMarching Cubesがある。
このMarching Cubesアルゴリズムは、 1985年に米国で特許となったが、20年を経過したので、現在では自由に利用できる。
gnuplot入門 †
このような可視化アルゴリズムを実装したソフトウェアは既に各種開発されており、可視化ソフトウェアとかグラフソフトなどと呼ばれる。 この演習では、そのなかで無償で利用出来るgnuplotを利用する。 (なお、gnuplotはGNUのソフトウェアではない。)
/usr/bin/gnuplot
または
/mnt/nfs/usr/bin/gnuplot
というコマンド打てばgnuplotが立ち上がる。
gnuplotコマンドプロンプトに
plot sin(x)
と打ち込んでみよう。sin関数がプロットされるはずである。 上に例として示したxのx乗のグラフは plot x**xとすれば見える。
gnuplotの終了はコマンドプロンプトでquitと打つ。
gnuplotではこのように解析的に定義された関数をターミナルに打ち込んでそのグラフを描く機能がある。 それに加えて、ファイルに書き込まれた離散データを読み込み、それをグラフにする機能もある。 この機能を使ってheat1.f90で計算した正方形領域の中心点での温度が、 ヤコビ法によって次第に収束して行く様子を可視化してみよう。
【演習】1次元グラフ1 †
(1) heat1.f90の出力(標準出力)をファイルtest.dataという名前に保存せよ。
- コンパイルはpgf95 heat1.f90
- ./a.out > test.data でリダイレクトされる。
(2) test.dataの中身を確認せよ
- エディタで開くよりもheadコマンドやtailコマンドで見る方が早い。
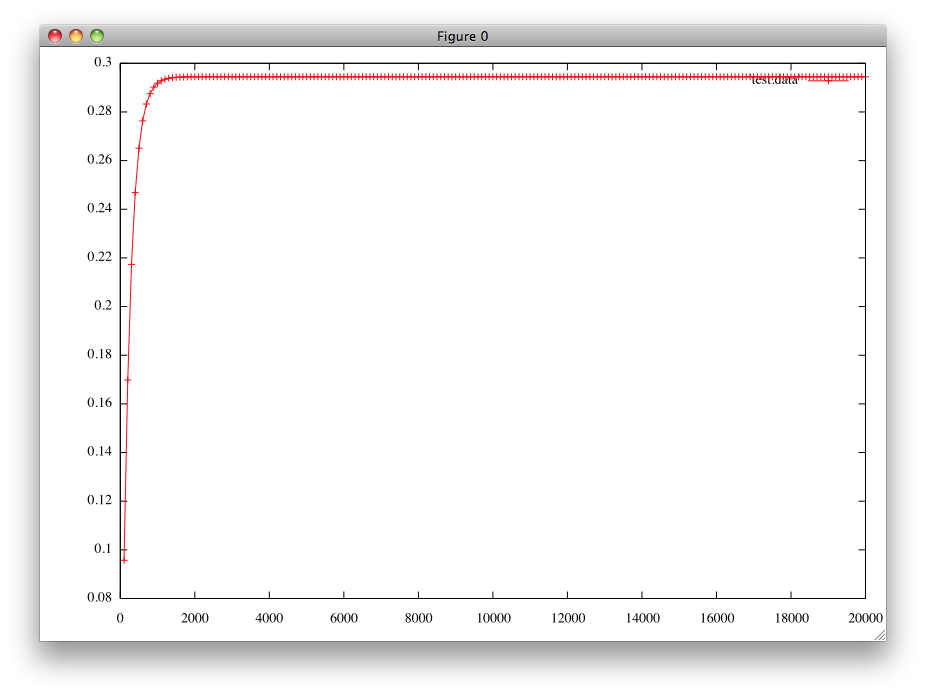
(3) gnuplotを立ち上げ、コマンドプロンプトに plot 'test.data' w lp と入れよ。 lpはlinespointsの略で、線(line)と点(point)を表示することを意味する。 (w linespointsと書いてもよい。)
結果例 †
【演習】1次元グラフ2 †
(1) 上の図の中で文字とグラフが重なって見にくいので、文字を消す。 gnuplotのコマンドプロンプトで
unset key
と入れ、それに続いて
replot
と打て。
(2) 縦軸の表示範囲を調整をする。 gnuplotのコマンドプロンプトで
set yrange [0:0.35]
replot
と打て。
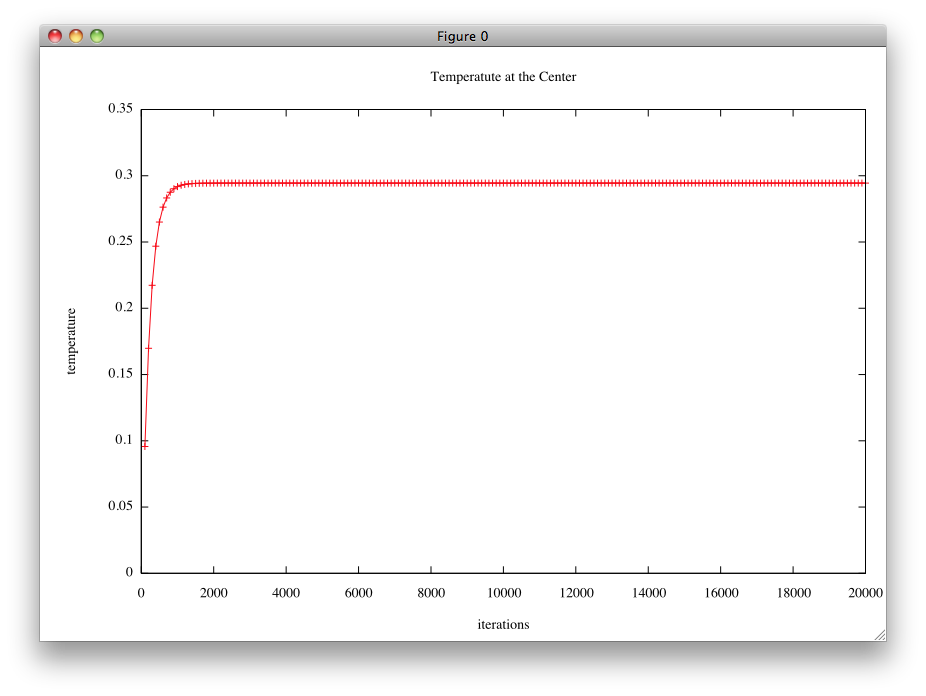
(3) 図全体のタイトルと、x軸、y軸の説明を入れる。
set title "Temperatute at the Center"
set xlabel "iterations"
set ylabel "temperature"
replot
と打て。
結果例 †
【演習】1次元グラフ3 †
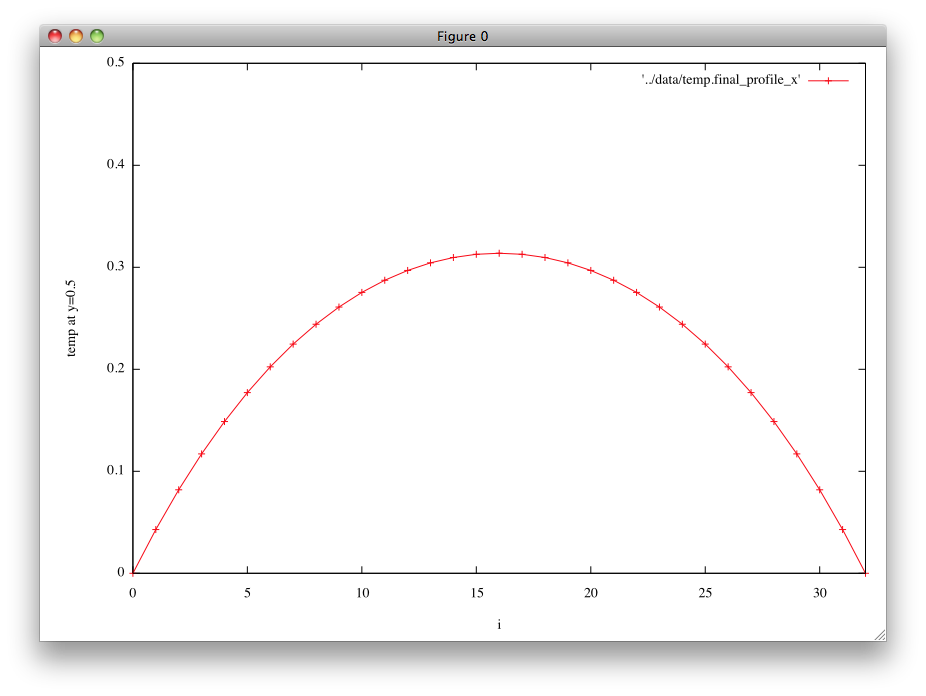
heat1.f90で計算された最終的な平衡温度分布をgnuplotで見てみよう。 正方形を真ん中で横に切るy=0.5の線上での温度のx分布をグラフにする。
(1) これからの演習でデータファイルを多数生成するので、データファイル出力先のディレクトリを用意しよう。 例えばいまソースコードの置いていあるディレクトリと同じ高さに
mkdir ../data
などとしてdataディレクトリを作成すること。別の場所、名前でも構わないが、以後のサンプルコードではそれに応じて適宜dataディレクトリの名前を変更すること。
(2) 以下のプログラムをheat1_print_final_x_prof.f90 という名前のソースコードにコピーし、コンパイル・実行せよ。
program heat1_print_final_x_prof
  implicit none
  integer, parameter :: m=31, nmax=5000
  integer :: i,j,n
  integer, parameter :: SP = kind(1.0)
  integer, parameter :: DP = selected_real_kind(2*precision(1.0_SP))
  real(DP), dimension(:,:), allocatable :: u, un
  real(DP) :: h, heat=1.0_DP, heat_hsq
  allocate(u(0:m+1,0:m+1))
  allocate(un(m,m))
  h = 1.0_DP/(m+1)
  heat_hsq = heat*h*h
  u(:,:) = 0.0_DP
  open(10,file='../data/temp.final_profile_x')
  do n = 1 , nmax
    do j = 1 , m
      do i = 1 , m
!       un(i,j)=(u(i-1,j)+u(i+1,j)+u(i,j-1)+u(i,j+1))/4.0_DP+heat*h*h
        un(i,j)=(u(i-1,j)+u(i+1,j)+u(i,j-1)+u(i,j+1))*0.25_DP+heat_hsq
      end do
    end do
    u(1:m,1:m)=un(1:m,1:m)
  end do
  do i = 0 , m+1
     write(10,*) i, u(i,m/2+1)
  end do
  deallocate(u,un)
  close(10)
end program heat1_print_final_x_prof
ディレクトリ../dataにtemp.final_profile_xという名前のファイルが出来ているはずである。
【演習】1次元グラフ4 †
../data/temp.final_profile_xのデータをgnuplotでグラフにする。
(1) このデータの中身をエディタまたはheadコマンド、tailコマンドで確認せよ。
(2) gnuplotではコマンドプロンプトに入力する内容をスクリプトファイルから読み込ませることが出来る。 以下の内容をheat1_print_final_x_prof.gpという名前のファイルに保存せよ。
#
# heat1_print_final_x_prof.gp
#
# final temperature profile at y=0.5 as a function of x
#
set xrange [0:32]
set yrange [0:0.5]
set xlabel 'i'
set ylabel 'temp at y=0.5'
plot '../data/temp.final_profile_x' w lp
pause -1
(3) gnuplotがまだ立ち上がっていたらquitコマンドで終了し、改めてshellで
gnuplot heat1_print_final_x_prof.gp
と打て。
結果例 †
(4) ファイルheat1_print_final_x_prof.gpを自由に変更してグラフがどう変わるか試せ。 なお、gnuplotのヘルプはコマンドプロンプトでhelpと打てば得られる。
アニメーション用データの生成 †
次にアニメーションによって収束の様子を確認しよう。 そのためのデータ(連番つきファイル群)を書き出すためのプログラム heat_animation_x_prof.f90 を以下に示す。 このプログラムをpgf90コマンドでコンパイルし、 実行すればdataディレクトリに連番ファイルが出力される。
module constants
  implicit none
  integer, parameter :: m=61, nmax=5000
  integer, parameter :: SP = kind(1.0)
  integer, parameter :: DP = selected_real_kind(2*precision(1.0_SP))
end module constants

module print
  use constants
  implicit none

contains

  subroutine print__profile(f)
    real(DP), dimension(0:m+1), intent(in) :: f
    integer :: i
    integer :: counter = 0  ! automatic save attribute
    character(len=*), parameter :: base = "../data/temp.j=middle."
    character(len=4) :: serial_num
    write(serial_num,'(i4.4)') counter
    open(10,file=base//serial_num)
    do i = 0 , m+1
       write(10,*) i, f(i)
    end do
    close(10)
    counter = counter + 1
  end subroutine print__profile
end module print

program heat1_animation_x_prof
  use constants
  use print
  implicit none
  integer :: i,j,n
  real(DP), dimension(:,:), allocatable :: u, un
  real(DP) :: h, heat=1.0_DP
  real(DP) :: random
  allocate(u(0:m+1,0:m+1))
  allocate(un(m,m))
  h = 1.0_DP/(m+1)
  u(:,:) = 0.0_DP
  call print__profile(u(:,m/2+1))
  do n=1, nmax
    do j=1, m
      do i=1, m
        un(i,j)=(u(i-1,j)+u(i+1,j)+u(i,j-1)+u(i,j+1))/4.0_DP+heat*h*h
      end do
    end do
    u(1:m,1:m)=un(1:m,1:m)
    if (mod(n,100)==0) call print__profile(u(:,m/2+1))
  end do
  deallocate(u,un)
end program heat1_animation_x_prof
gnuplotによるアニメーション †
gnuplotのスクリプトを使えばアニメーションも簡単にできる。 ただし、コマ数が多くなると手でスクリプトを書くのは難しくなるので、 「gnuplotスクリプト自動生成プログラム」を作ったほうがよい。 以下はその例である。
【演習】1次元グラフ アニメーション †
以下のコードを heat1_animation_x_prof_gp_generator.f90 というファイルに保存し、ソースコードの冒頭にあるUsageに従ってgnuplotによる可視化アニメーションを作れ。
!
! heat1_animation_x_prof_gp_generator.f90
!
!    by  Akira Kageyama
!    at  Kobe University
!    on  2010.07.07
!   for  data visualization of heat1_animation_x_prof.f90
!    in  the Lecture "Computational Science" (2010)
!
! Usage:
!    (1) check the mesh size m and the counter_end.
!    (2) pgf95 this_code
!    (3) ./a.out > anyname
!    (4) gnuplot anyname
!

program heat1_animation_x_prof_gp_generator
  implicit none
  integer, parameter :: m = 61
  integer :: counter, counter_end = 50
  character(len=*), parameter :: base='../data/temp.j=middle.'
  character(len=4)            :: serial_num

  print *, "#"
  print *, "# gnuplot script generated by heat1_animation_x_prof_gp_generator.f90"
  print *, "#"
  print *, " "
  print *, "set xlabel 'j'              # x-axis"
  print *, "set ylabel 'temperature'    # y-axis"
  print *, "set xrange[0:", m+1, "]     # j-grid min & max"
  print *, "set yrange[0.0:0.5]         # temperature min & max"

  do counter = 0 , counter_end
     write(serial_num,'(i4.4)') counter
     print *, "plot '"//base//serial_num//"' w lp"
     if ( counter==0) then
        print *, "pause 5"
     else
        print *, "pause 1"
     end if
  end do
  print *, "pause -1"
end program heat1_animation_x_prof_gp_generator
熱伝導問題コードのリファクタリング †
1次元的な可視化(グラフ)はこのように簡単である。 これ以降、次に正方形領域の温度場全体を表示する2次元的な可視化を行う。 ここでもやはりgnuplotを使うが、可視化機能の追加だけでなく、これからの演習では、これまで学んだ y方向のみの分割による並列化(1次元領域分割による並列化)よりももう少し実際的な2次元領域分割による並列化と、さらには、3次元熱伝導問題を解く問題にも挑戦したい。
したがって、今後扱うコードは少しづつ複雑化していくので、ここでまずはheat2.f90(並列版コード)のリファクタリングをしておこう。
以下のコードをthermal_diffusion.f90という名前で保存せよ。
!
! thermal_diffusion.f90
!
module constants
  implicit none
  integer, parameter :: SP = kind(1.0)
  integer, parameter :: DP = selected_real_kind(2*precision(1.0_SP))
  integer, parameter :: MESH_SIZE = 61
  integer, parameter :: LOOP_MAX = 10000
end module constants

module parallel
  use constants
  use mpi
  implicit none
  private
  public :: parallel__initialize,       &
            parallel__finalize,         &
            parallel__sendrecv,         &
            parallel__set_prof_1d,      &
            parallel__set_prof_2d,      &
            parallel__tellme

  integer :: nprocs
  integer :: myrank, left, right
  integer :: jstart, jend

contains

  subroutine parallel__finalize
    integer :: ierr
    call mpi_finalize(ierr)
  end subroutine parallel__finalize

  subroutine parallel__initialize
    integer :: ierr
    call mpi_init(ierr)
    call mpi_comm_size(MPI_COMM_WORLD, nprocs, ierr)
    call mpi_comm_rank(MPI_COMM_WORLD, myrank, ierr)
    left  = myrank - 1
    right = myrank + 1
    if ( myrank==0 )        left  = nprocs-1
    if ( myrank==nprocs-1 ) right = 0
    jstart = MESH_SIZE * myrank / nprocs + 1
    jend   = MESH_SIZE * (myrank+1) / nprocs
  end subroutine parallel__initialize

  subroutine parallel__sendrecv(send_vector,rank_target,        &
                                recv_vector,rank_source)
    real(DP), dimension(:), intent(in)  :: send_vector
    integer,                intent(in)  :: rank_target
    real(DP), dimension(:), intent(out) :: recv_vector
    integer,                intent(in)  :: rank_source

    integer, dimension(MPI_STATUS_SIZE) :: istat
    integer :: tag_dummy = 100
    integer :: n, ierr
    n = size(send_vector,dim=1)
    call mpi_sendrecv(send_vector,              &
                      n,                        &
                      MPI_DOUBLE_PRECISION,     &
                      rank_target,              &
                      tag_dummy,                &
                      recv_vector,              &
                      n,                        &
                      MPI_DOUBLE_PRECISION,     &
                      rank_source,              &
                      tag_dummy,                &
                      MPI_COMM_WORLD,           &
                      istat,                    &
                      ierr)
  end subroutine parallel__sendrecv

  function parallel__set_prof_1d(jstt_,jend_,myprof) result(prof_1d)
    integer,  intent(in)                         :: jstt_
    integer,  intent(in)                         :: jend_
    real(DP), dimension(jstt_:jend_), intent(in) :: myprof
    real(DP), dimension(0:MESH_SIZE+1)           :: prof_1d

    real(DP), dimension(0:MESH_SIZE+1) :: work
    integer                            :: ierr

    work(:) = 0.0_DP
    work(jstt_:jend_) = myprof(jstt_:jend_)
    call mpi_allreduce(work,                    &  ! source
                       prof_1d,                 &  ! target
                       MESH_SIZE+2,             &
                       MPI_DOUBLE_PRECISION,    &
                       MPI_SUM,                 &
                       MPI_COMM_WORLD,          &
                       ierr)
  end function parallel__set_prof_1d

  function parallel__set_prof_2d(jstt_,jend_,myprof) result(prof_2d)
    integer,  intent(in)                             :: jstt_
    integer,  intent(in)                             :: jend_
    real(DP), dimension(0:MESH_SIZE+1,jstt_:jend_),                    &
                                          intent(in) :: myprof
    real(DP), dimension(0:MESH_SIZE+1,0:MESH_SIZE+1) :: prof_2d

    real(DP), dimension(0:MESH_SIZE+1,0:MESH_SIZE+1) :: work
    integer :: ierr
    integer :: meshsize_p1_sq = (MESH_SIZE+1)**2

    work(:,:) = 0.0_DP
    work(:,jstt_:jend_) = myprof(:,jstt_:jend_)
    call mpi_allreduce(work(1,1),               &  ! source
                       prof_2d(1,1),            &  ! target
                       meshsize_p1_sq,          &
                       MPI_DOUBLE_PRECISION,    &
                       MPI_SUM,                 &
                       MPI_COMM_WORLD,          &
                       ierr)
  end function parallel__set_prof_2d

  function parallel__tellme(which) result(val)
    character(len=*), intent(in) :: which
    integer                      :: val

    select case (which)
      case  ('jend')
        val = jend
      case  ('jstart')
        val = jstart
      case  ('left')
        val = left
      case  ('right')
        val = right
      case  ('myrank')
        val = myrank
      case  ('nprocs')
        val = nprocs
    end select
  end function parallel__tellme

end module parallel


module temperature
  use constants
  use parallel
  implicit none
  private
  public :: temperature__initialize,            &
            temperature__finalize,              &
            temperature__output_1d_profile,     &
            temperature__output_2d_profile,     &
            temperature__update

  real(DP), allocatable, dimension(:,:) :: temp
  real(DP), allocatable, dimension(:,:) :: work
  real(DP), parameter :: SIDE = 1.0_DP
  real(DP) :: h = SIDE / (MESH_SIZE+1)
  real(DP) :: heat
  integer  :: jstart, jend
  integer  :: myrank, right, left, nprocs

  !
  !               |<----------- SIDE ---------->|
  !               |                             |
  !               |<-h->|                       |
  !               0     1     2    ...       MESH_SIZE+1
  !        jend+1 +-----+-----+-----+-----+-----+
  !               |     |     |     |     |     |
  !               |     |     |     |     |     |
  !          jend +-----+-----+-----+-----+-----+
  !               |     |     |     |     |     |
  !            .
  !            .      temp(0:MESH_SIZE,0:jend+1)
  !            .
  !               |     |     |     |     |     |
  !        jstart +-----+-----+-----+-----+-----+
  !               |     |     |     |     |     |
  !               |     |     |     |     |     |
  !      jstart-1 +-----+-----+-----+-----+-----+
  !

contains

!----------------
!--- private  ---
!----------------

  subroutine set_jstart_and_jend(jstart_, jend_)
    integer, intent(out) :: jstart_, jend_
    if ( myrank==0 ) then
       jstart_ = 0
       jend_   = jend
    else if ( myrank==nprocs-1 ) then
       jstart_ = jstart
       jend_   = MESH_SIZE+1
    else
       jstart_ = jstart
       jend_   = jend
    end if
  end subroutine set_jstart_and_jend

!--------------
!--- public ---
!--------------

  subroutine temperature__initialize
    real(DP) :: heat_source = 4.0
    jstart = parallel__tellme('jstart')
    jend   = parallel__tellme('jend')
    myrank = parallel__tellme('myrank')
    right  = parallel__tellme('right')
    left   = parallel__tellme('left')
    nprocs = parallel__tellme('nprocs')
    allocate(temp(0:MESH_SIZE+1,jstart-1:jend+1))
    allocate(work(    MESH_SIZE,  jstart:jend)  )
    heat = (heat_source/4) * h * h
    temp(:,:) = 0.0_DP       ! initial condition
  end subroutine temperature__initialize

  subroutine temperature__finalize
    deallocate(work,temp)
  end subroutine temperature__finalize

  subroutine temperature__output_1d_profile
    real(DP), dimension(0:MESH_SIZE+1) :: prof
    integer                     :: counter = 0   ! saved
    integer                     :: ierr          ! use for MPI
    integer                     :: jstart_, jend_
    character(len=4)            :: serial_num    ! put on file name
    character(len=*), parameter :: base = "../data/temp.i=middle."
    integer, parameter          :: icut = MESH_SIZE/2+1 ! center
    !   nprocs = 3
    !   MESH_SIZE = 9
    !
    !    0     1     2     3     4     5     6     7     8     9    10
    !    +-----+-----+-----+-----+-----+-----+-----+-----+-----+-----+
    !    |<=====rank0=====>|     |<==rank1==>|     |<=====rank2=====>|
    !  jstart_ |         jend_   |           |     |           |     |
    !    |   jstart      jend  jstart_     jend_   |           |     |
    !    |     |           |   jstart      jend  jstart_       |   jend_
    !    |     |           |     |           |   jstart      jend    |
    !    |     |           |     |           |     |           |     |
    !    +-----+-----+-----+-----+-----+-----+-----+-----+-----+-----+
    !
    integer :: j
    call set_jstart_and_jend(jstart_,jend_)
    write(serial_num,'(i4.4)') counter
    prof(:) = parallel__set_prof_1d(jstart_,jend_,temp(icut,jstart_:jend_))
    if ( myrank==0 ) then
       open(10,file=base//serial_num)
       do j = 0 , MESH_SIZE+1
          write(10,*) j, prof(j)
       end do
       close(10)
    end if
    counter = counter + 1
  end subroutine temperature__output_1d_profile

  subroutine temperature__output_2d_profile
    real(DP), dimension(0:MESH_SIZE+1,    &
                        0:MESH_SIZE+1) :: prof
    integer                            :: counter = 0   ! saved
    integer                            :: ierr          ! use for MPI
    integer                            :: jstart_, jend_
    character(len=4)                   :: serial_num    ! put on file name
    character(len=*), parameter        :: base = "../data/temp.2d."
    integer :: i, j
    call set_jstart_and_jend(jstart_,jend_)
    write(serial_num,'(i4.4)') counter
    prof(:,:) = parallel__set_prof_2d(jstart_,jend_,temp(:,jstart_:jend_))
    if ( myrank==0 ) then
       open(10,file=base//serial_num)
       do j = 0 , MESH_SIZE+1
          do i = 0 , MESH_SIZE+1
             write(10,*) i, j, prof(i,j)
          end do
          write(10,*)' ' ! gnuplot requires a blank line here.
       end do
       close(10)
    end if
    counter = counter + 1
  end subroutine temperature__output_2d_profile

  subroutine temperature__update
    integer :: i, j
    call parallel__sendrecv(temp(1:MESH_SIZE,jend),     right,   &
                            temp(1:MESH_SIZE,jstart-1), left  )
    call parallel__sendrecv(temp(1:MESH_SIZE,jstart),   left,    &
                            temp(1:MESH_SIZE,jend+1),   right )
    if ( myrank==0 )        temp(1:MESH_SIZE,0          ) = 0.0_DP
    if ( myrank==nprocs-1 ) temp(1:MESH_SIZE,MESH_SIZE+1) = 0.0_DP
    !
    ! Time development form of the thermal diffusion equation is
    !    \partial T(x,y,t) / \partial t = \nabla^2 T(x,y,t) + heat_source.
    ! In the stationary state,
    !    \nabla^2 T(x,y) + heat_source = 0.
    ! The finite difference method with grid spacings dx and dy leads to
    !    (T(i+1,j)-2*T(i,j)+T(i-1,j))/dx^2
    !  + (T(i,j+1)-2*T(i,j)+T(i,j-1))/dy^2 + heat_source = 0.
    ! When dx=dy=h,
    !    T(i,j) = (T(i+1,j)+T(i-1,j)+T(i,j+1)+T(i,j-1))/4+heat_source*h^2/4.
    ! This suggests a relaxation method by the following
    ! update procedure called Jacobi method;
    do j = jstart, jend
      do i = 1, MESH_SIZE
!       work(i,j) = (temp(i-1,j)+temp(i+1,j)+temp(i,j-1)+temp(i,j+1))/4.0_DP   &
!                 + heat_source*h*h   ! Operation time is saved in below.
        work(i,j) = (temp(i-1,j)+temp(i+1,j)+temp(i,j-1)+temp(i,j+1))*0.25_DP  &
                  + heat
      end do
    end do
    temp(1:MESH_SIZE,jstart:jend) = work(1:MESH_SIZE,jstart:jend)
  end subroutine temperature__update

end module temperature


program thermal_diffusion
  use constants
  use parallel
  use temperature
  implicit none
  integer :: loop

  call parallel__initialize
  call temperature__initialize
  call temperature__output_1d_profile
  call temperature__output_2d_profile
  do loop = 1 , LOOP_MAX
     call temperature__update
     if ( mod(loop,100)==0 ) call temperature__output_1d_profile
     if ( mod(loop,100)==0 ) call temperature__output_2d_profile
  end do
  call temperature__finalize
  call parallel__finalize
end program thermal_diffusion
読みやすくなるように書き換えただけで、コードの内容は本質的にはheat2.f90と同じである。 (変数名も一部変えている。) ただし、可視化するためのデータ書き出しルーチン
call temperature__output_1d_profile
call temperature__output_2d_profile
を二つ追加している。(main プログラムのdo-loopの中。)
サブルーチンtemperature__output_1d_profileでは正方形を真ん中で縦に切る線上(x=1/2)での温度の分布を出力する。 つまり、yが0から1.0までの温度を出力するわけであるが、このコード(もともとのheat2.f90と同じ)ではy方向に領域分割して並列化をしているので、 温度のデータは各プロセスが個別の持っている。 それを集約してprof(:)という1次元配列(添字の範囲はj=0からMESH_SIZE+1まで)に収めている。 ここでMPI_ALLREDUCE関数を利用している。
参考までにこのジョブを計算機「scalar」に投入するためのジョブスクリプトのサンプルを示す:
#PBS -l cputim_job=00:05:00
#PBS -l memsz_job=2gb
#PBS -l cpunum_job=1
#PBS -T vltmpi
#PBS -b 16
#PBS -q PCL-A

cd /home/users/YournID/YourDirectory
mpirun_rsh -np 16 ${NQSII_MPIOPTS} ./a.out
このジョブスクリプトをthermal_diffusion.jsというファイルに保存すれば、
qsub thermal_diffusion.js
でscalarに投入できる。
宿題 †
上記 thermal_diffusion.f90コードを理解しておくこと。(レポート提出必要なし。)
授業アンケート †
今回の演習内容はどうでしたか?(どれか一つ、一度だけ押してください。)
質問、コメントなど自由にどうぞ †
「お名前」欄は空欄で可。
コメントはありません。 コメント/6.2 1次元可視化?
as of 2025-07-09 (水) 19:32:08 (6990)

